MIMIC-III Hospital Outcomes Dashboard
A Tableau dashboard built on the public MIMIC-III demo dataset, tracking admissions, mortality, length of stay, and diagnosis patterns across a 100-patient ICU cohort, with an explicit caveat about how much a sample that size can actually support.
Why MIMIC-III
MIMIC-III is a widely used, deidentified critical-care database published through PhysioNet. Its 100-patient demo subset is the standard sandbox for practicing health-data analysis without needing credentialed access to the full dataset. I built this dashboard in Tableau as a personal exercise in descriptive clinical analytics — admissions, mortality, length of stay, and diagnosis patterns, the questions a hospital ops or quality team asks before any modeling starts.
Note 1The demo subset is a convenience sample built for teaching and code demos, not a representative hospital population. I kept that distinction visible on purpose — see the caveat below.What’s on the dashboard
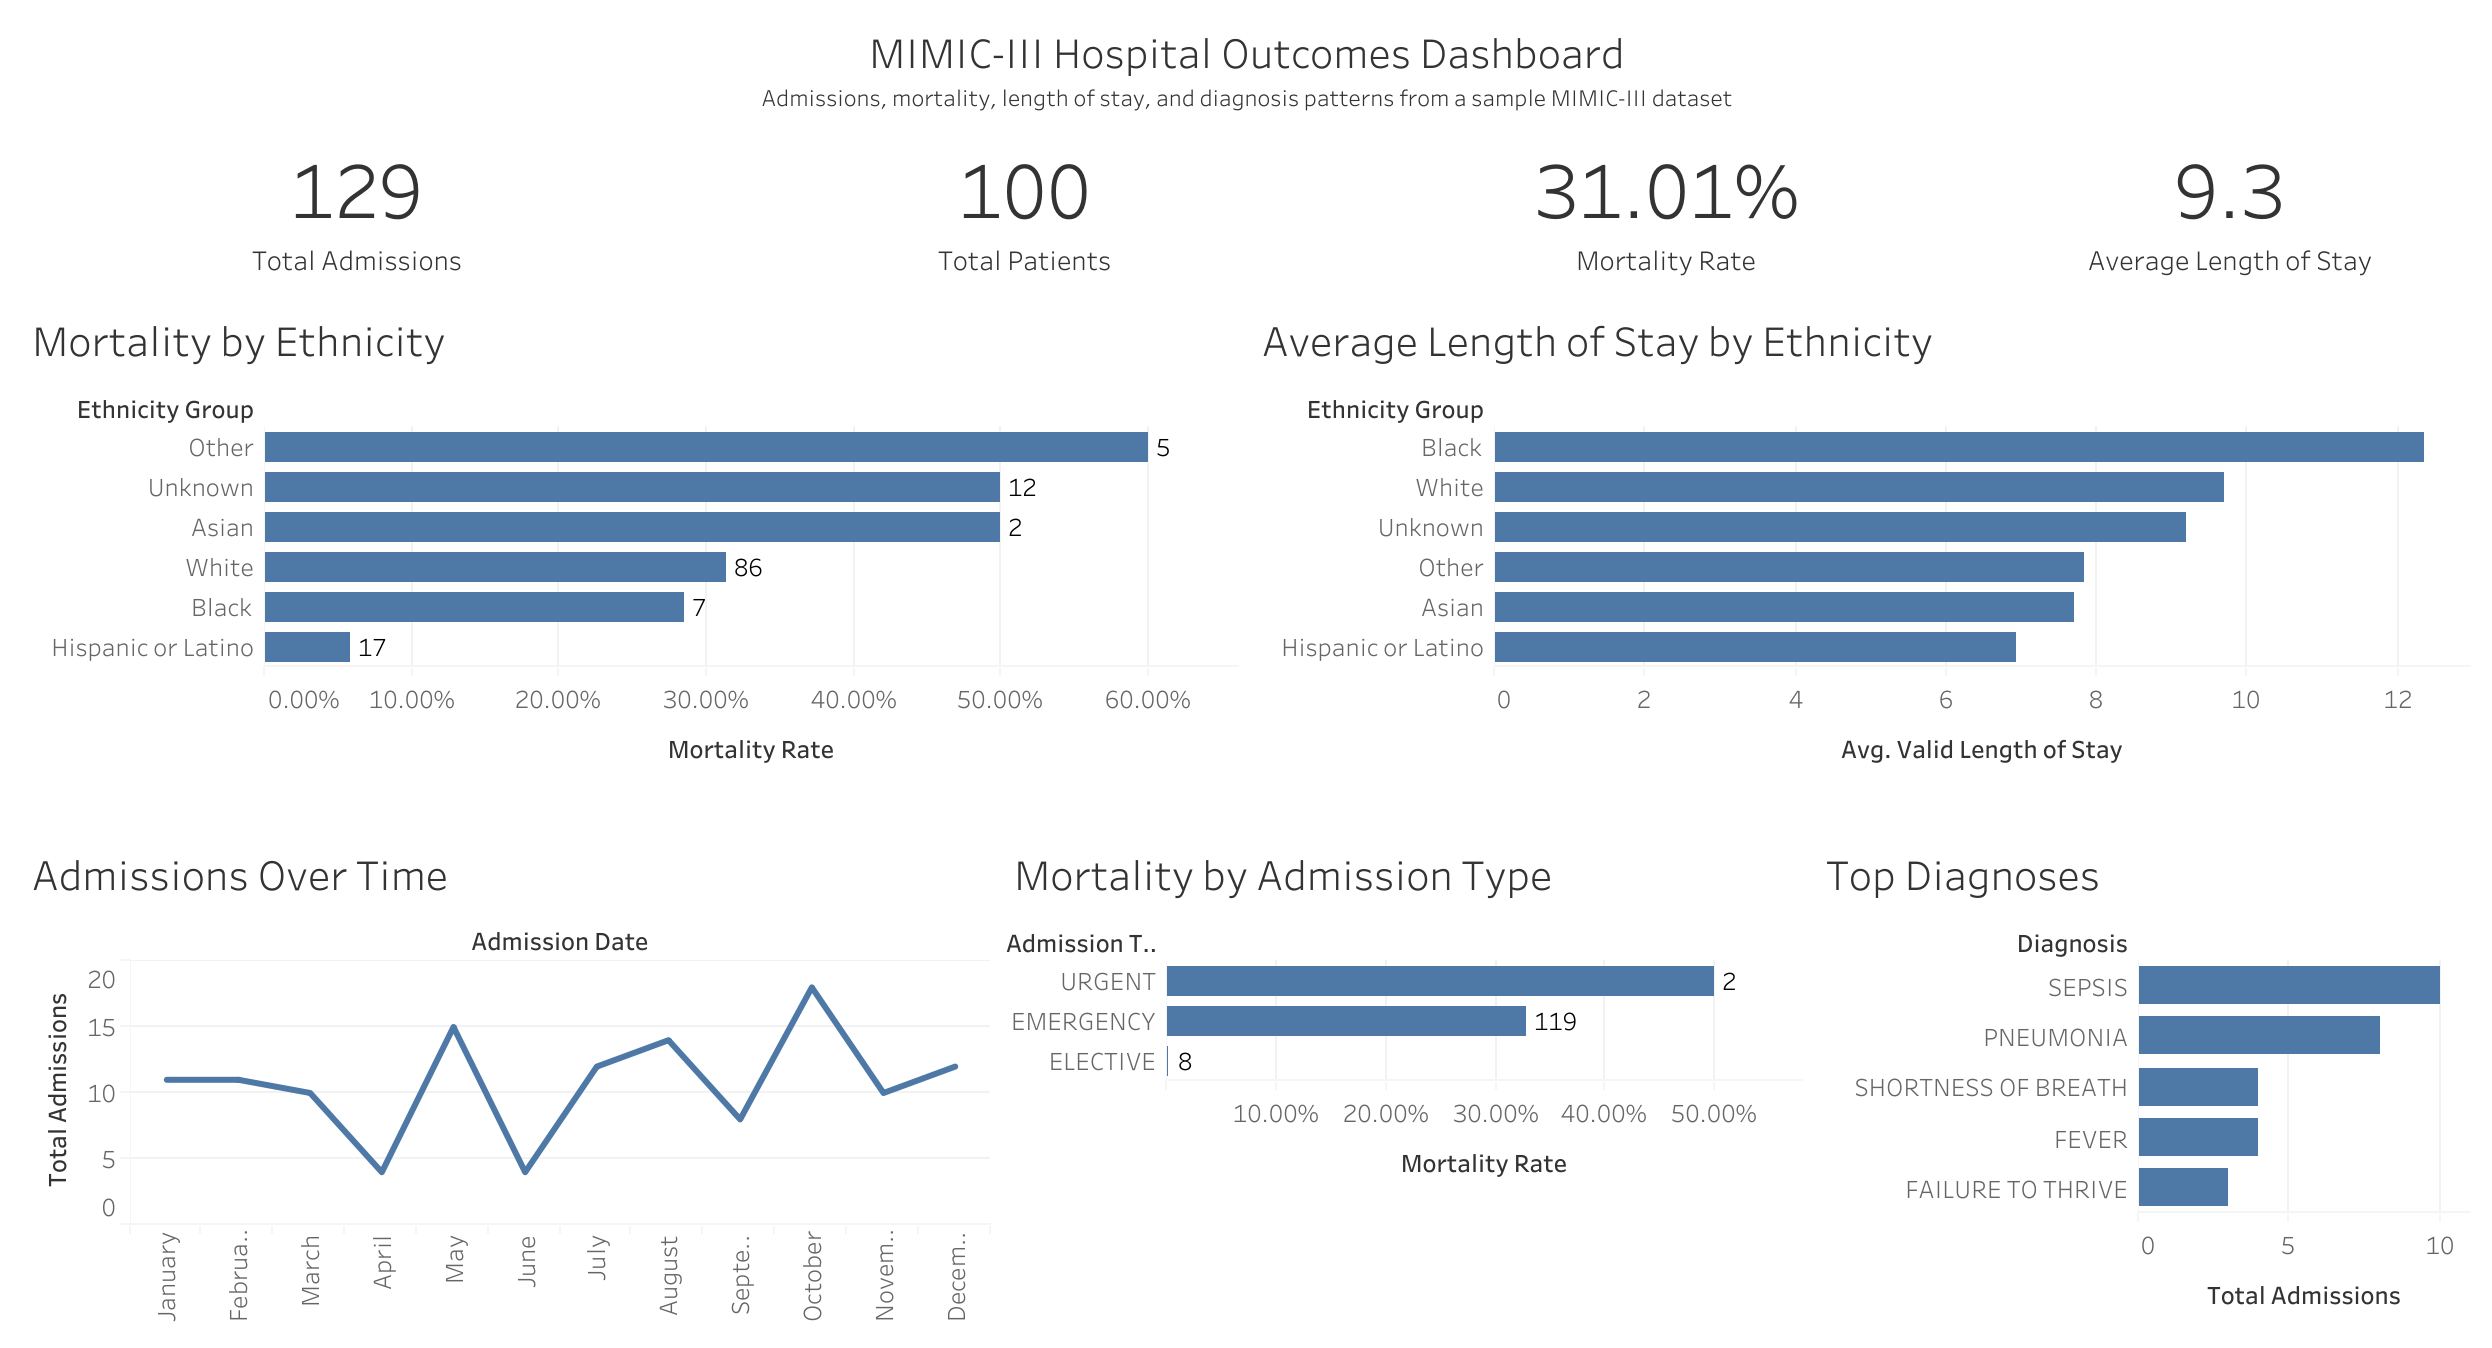
Four KPI tiles anchor the top: total admissions, total patients, mortality rate, and average length of stay. Below them, five panels break the same cohort down by ethnicity, admission type, time, and diagnosis.
Design decisions
- KPI row first. Every panel below inherits that context — a 31% mortality, 9.3-day-stay cohort — so no single segment gets read in isolation from the whole.
- Ethnicity panels paired, not scattered. Mortality by ethnicity sits directly beside average length of stay by ethnicity, in the same category order, so a viewer can cross-reference rate against duration for a given group without holding two separate charts in their head.
- A line, not a bar, for admissions over time. That panel exists to show shape and volume across the year, not a month-by-month comparison, so a continuous line reads faster than twelve individual bars.
- Sorted categorical bars everywhere else. Ethnicity, admission type, and diagnosis panels are all sorted by value rather than alphabetically, so the largest driver is always the first thing a viewer sees.
The caveat I want stated plainly
A 100-patient demo sample is small enough that several of these breakdowns shouldn’t be read as findings. The Asian group has 2 admissions; the Black group has 7. A single-digit count can swing a mortality-rate bar dramatically without saying anything about the underlying population, and a clean chart shouldn’t imply more confidence than 7 records can support. The 31% overall mortality rate is also far higher than any real hospital’s actual rate — demo and teaching subsets like this one aren’t built to be representative, and I’d flag that directly on the dashboard itself if this were headed anywhere beyond a portfolio.
Where it goes next
The honest next step is the full MIMIC-III database under proper credentialed PhysioNet access, with sample-size annotations built into every categorical panel instead of left to a caption, and a significance test behind any ethnicity comparison before it ships as a claim instead of a prompt for more data.